Have you ever wondered how security researchers figure out what's actually going on inside the apps on your phone? How they find out what methods get called, what data flows through memory, what checks an app runs before it lets you do something? Maybe you're an aspiring hacker who wants to learn how to poke around iOS apps. Maybe you've done some static analysis with Hopper or Ghidra but you want to see what an app is doing live, in real time, on an actual device. Or maybe you're coming from a GDB background and want to learn the LLDB equivalent for iOS work.
Either way, this article is for you. We'll start from zero, get a debugger attached to a real app on a real device, and work through every core command you need to start poking around on your own.
What You Need
A few things before we start:
- A Mac or Linux machine with LLDB installed. On macOS it comes with Xcode. On Linux you can install it through the LLVM packages (
apt install lldbon Debian/Ubuntu). Note that LLDB on Linux lacks Apple's Objective-C runtime modules, so the core commands (breakpoints, stepping, registers, memory, disassembly) will work fine over a remote debugserver connection, but ObjC-specific features likepoand Objective-C expression evaluation may not be available. For the full experience, macOS with Xcode's LLDB is recommended - A jailbroken iOS device plugged in via USB. We need jailbreak access to run debugserver and attach to system apps. If you're following along with our labs, the Corellium devices we provide come pre-jailbroken
- debugserver on the iOS device (we'll cover how to get it in the next section)
LLDB also works with the iOS Simulator on macOS. If you don't have a physical device, you can build a dummy app in Xcode and attach LLDB to it running in the Simulator. But this article focuses on real devices and Corellium devices since that's what you'll be working with in actual security research.
Quick check that LLDB is there. Open Terminal:
You should see the version number. If you do, we're good.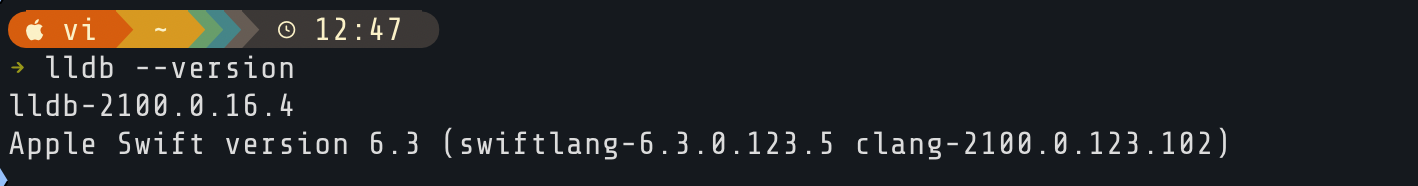
LLDB Command Cheat Sheet
Before we get into the details, here's a quick reference of every command we'll cover in this article. Don't worry about memorizing any of this now. Just know it's here so you can come back to it later.
Process Control
| Command | What It Does |
process attach --name |
Attach to a running process by name |
process attach --name |
Wait for a process to launch, then attach |
process connect connect:// |
Connect to a remote debugserver |
process status |
Show current process state |
c (continue) |
Resume execution |
detach |
Detach from process, let it keep running |
q (quit) |
Exit LLDB |
Breakpoints
| Command | What It Does |
b (breakpoint set --name) |
Break on a function/method name |
b -a (breakpoint set --address) |
Break on a memory address |
breakpoint set --selector |
Break on every class implementing a selector |
br l (breakpoint list) |
List all breakpoints |
breakpoint enable |
Enable a breakpoint |
breakpoint disable |
Disable a breakpoint |
breakpoint delete |
Delete a breakpoint |
breakpoint delete |
Delete all breakpoints |
Stepping
| Command | What It Does |
n (next) |
Step over (source level) |
s (step) |
Step in (source level) |
fin (finish) |
Step out, run to return |
ni |
Step over one instruction |
si |
Step into one instruction |
Threads and Backtraces
| Command | What It Does |
thread list |
List all threads |
bt (thread backtrace) |
Backtrace current thread |
bt all |
Backtrace all threads |
f (frame select) |
Switch to a specific frame |
Registers
| Command | What It Does |
register read |
Read all general-purpose registers |
register read |
Read specific registers |
register read pc |
Read the program counter |
register write |
Write a value to a register |
Memory
| Command | What It Does |
x (memory read) |
Read memory at an address |
x $x0 |
Read memory at address stored in x0 |
memory read --format s |
Read memory as a string |
memory read --size 1 --format x --count 64 |
Read 64 bytes in hex |
x/16xb |
Read 16 bytes in hex (shorthand) |
memory write |
Write a value to memory |
Expressions and Printing
| Command | What It Does |
expr (expression) |
Evaluate an expression |
expression (char *)$x1 |
Cast register to string |
po |
Print ObjC object description |
p |
Print raw value |
Disassembly
| Command | What It Does |
di -f (disassemble --frame) |
Disassemble current function |
disassemble --name " |
Disassemble a specific method |
disassemble --start-address |
Disassemble N instructions from address |
Watchpoints
| Command | What It Does |
watchpoint set expression -w write -- |
Watch for writes to an address |
watchpoint set expression -w read -- |
Watch for reads from an address |
watchpoint set expression -w read_write -- |
Watch for reads and writes |
watchpoint list |
List all watchpoints |
watchpoint delete |
Delete a watchpoint |
Other Useful Commands
| Command | What It Does |
help |
Show all commands |
help |
Show help for a specific command |
image list |
List all loaded libraries |
image list -f |
Find a specific loaded binary |
settings set stop-disassembly-display always |
Always show assembly on stop |
script |
Open Python interpreter |
Now that you've got the reference card, let's walk through each of these and see what they actually do.
Quick Objective-C Primer
You'll see Objective-C syntax throughout this article, and it looks nothing like C. You don't need to learn the language, but you need to recognize a few patterns or the LLDB output won't make any sense.
Method calls use square brackets, not parentheses. In C you'd write doSomething(object). In Objective-C it's [object doSomething]. Brackets mean Objective-C. You can nest them: [[UIApplication sharedApplication] keyWindow] calls one method on the result of another.
A selector is just a method name. When you see viewDidAppear:, that's a selector. The colon means it takes an argument. Two colons like doThis:withThat: means two arguments. When you set a breakpoint on a method in LLDB, you're matching selectors. When you read register x1 at a breakpoint, that's the selector.
-+ means class method. So -[UIViewController viewDidAppear:] is called on a specific view controller object. +[UIApplication sharedApplication] is called on the class itself, like a static function.
@"hello"@ prefix turns a C string into an NSString object. You'll use this when calling functions like NSLog from LLDB.
Every method call goes through objc_msgSend. This is the key insight for reverse engineering. When you write [object doSomething:argument], the runtime actually calls objc_msgSend(object, "doSomething:", argument). On ARM64 that means x0 holds the object, x1 holds the selector, and x2 onwards hold the arguments. Once you know this, you can read x0 and x1 at any breakpoint and immediately know which object is doing what.
How the Pieces Fit Together
Quick bit of background so you know what's happening under the hood. When you debug an iOS app from your computer, there are two players:
- LLDB runs on your computer. It's the client, the thing you type commands into.
- debugserver runs on the iOS device. It's the piece that actually attaches to the target process, reads its memory, sets breakpoints, and reports back to LLDB.
LLDB on your computer talks to debugserver on the device over a network connection (usually tunneled over USB). You type a command, LLDB sends it to debugserver, debugserver does the work on the device, and the result comes back to your terminal.
Before any of this can happen, we need to set up three things: port forwarding so your computer can talk to the device, debugserver on the device, and LLDB on your computer. Let's go through them in order.
Port Forwarding Over USB
Your computer needs to reach a port on the iOS device. You don't want to rely on Wi-Fi for this. The solution is iproxy (part of libimobiledevice), which forwards a local port on your computer to the device over USB.
On macOS: brew install libimobiledevice
On Linux: apt install libimobiledevice-utils
Then run:
This maps localhost:1234 on your computer to port 1234 on the USB-connected device. Keep this running in a separate terminal for the rest of the article.
Getting debugserver Onto the Device
debugserver doesn't come pre-installed on iOS. You either extract it from Xcode or grab it from the internet.
Option 1: Extract It from Xcode (macOS only)
If you're on a Mac with Xcode installed, debugserver is bundled inside the Xcode app. The typical path is:
If that doesn't match your Xcode version, just use find:
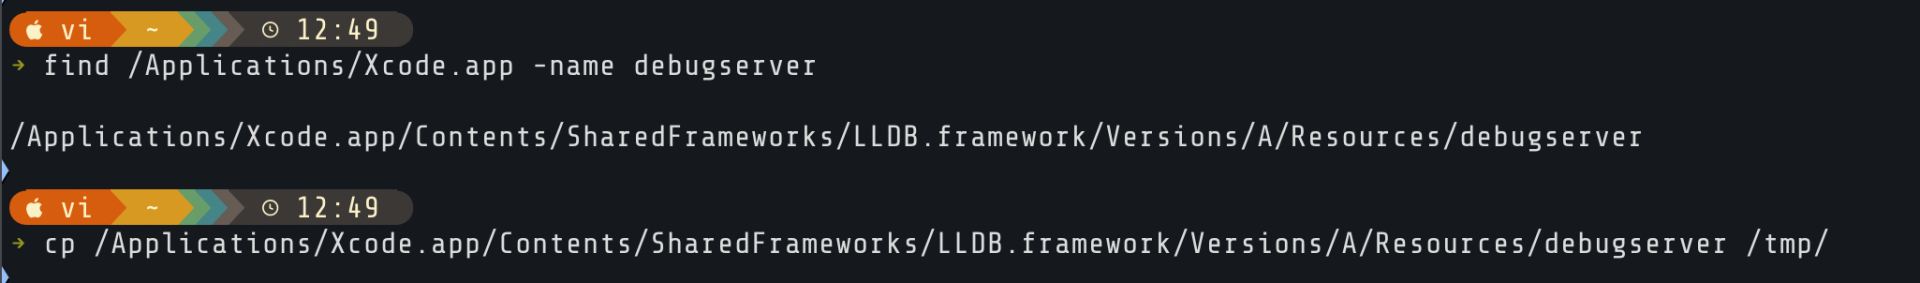
Now we can simply scp the binary file to the device.
However, the version you pull out of Xcode still needs to be re-signed with proper entitlements before it can attach to arbitrary processes. We'll do the signing on the device itself using ldid, which is commonly available on jailbroken devices.
Option 2: Extract it from Xcode's xip
If you do not use macOS, you can still download Xcode from https://developer.apple.com/download/applications/. You will need an Apple account to be able to download it. Once downloaded, you can find the binary with 7zip or any other archiving tool capable of unpacking an xip file:
Copying debugserver to the Device
Copy debugserver to your jailbroken device over SSH:
Then SSH into the device and make sure it's executable:
Signing debugserver on the Device
The version you pull out of Xcode needs to be re-signed with proper entitlements before it can attach to arbitrary processes. On the device, create a file called entitlements.plist:
Then sign it with ldid:
Launching LLDB and Connecting
Open a terminal on your computer (not the one running iproxy) and fire up LLDB:
You get the prompt:
Think of it like a shell, except instead of talking to your OS, you're talking to something that can reach inside a live process and do pretty much whatever it wants.
To connect to the device, you'll use:
But don't run that yet. We need debugserver running on the device first. Let's set that up.
Starting debugserver on the Device
First, we need to find the Clock app's binary path on the device. Apple's internal names rarely match what's on the home screen. SSH into the device and use find:
You'll get multiple results:
The one we want is the .app path under /private/var/containers/Bundle/Application/. The UUID in the path will be different on your device.
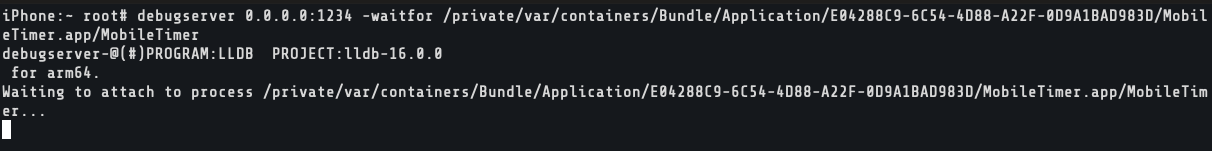
Attaching to a Running App
Open the Clock app on your iPhone, then attach debugserver to it:
This tells debugserver to attach to the Clock app and listen for LLDB connections on port 1234. 0.0.0.0 means listen on all interfaces.
Note that the process needs to be running. If you try to attach without opening the app first, you'll get an error:
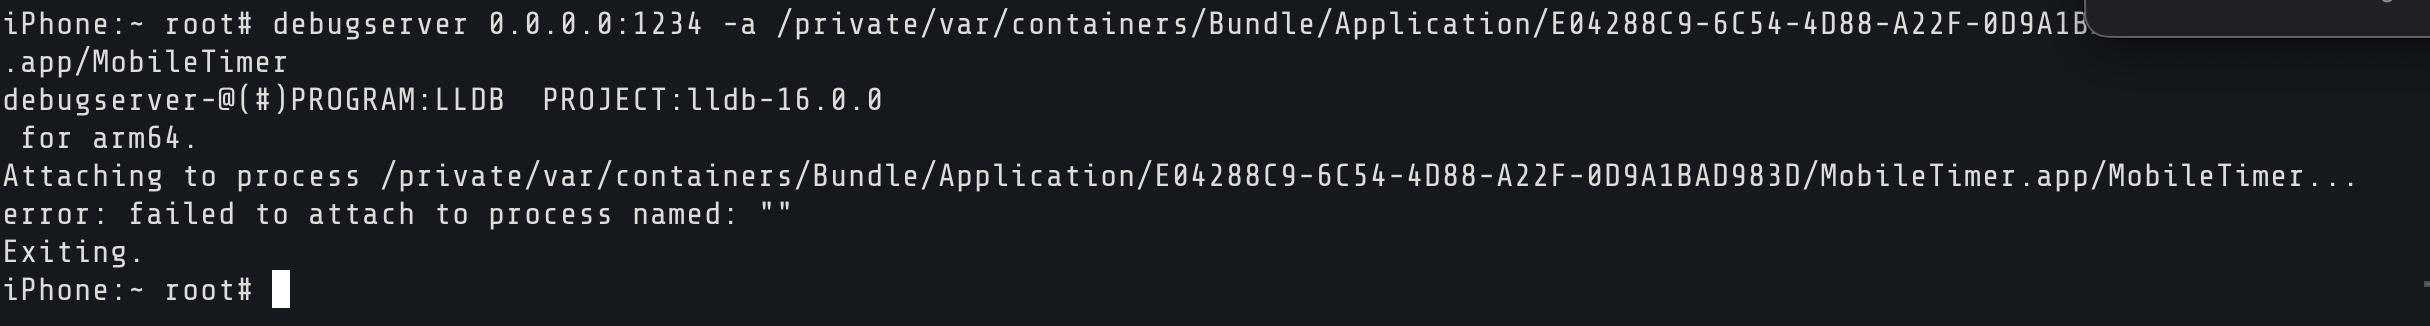
You should see output confirming it attached to the process: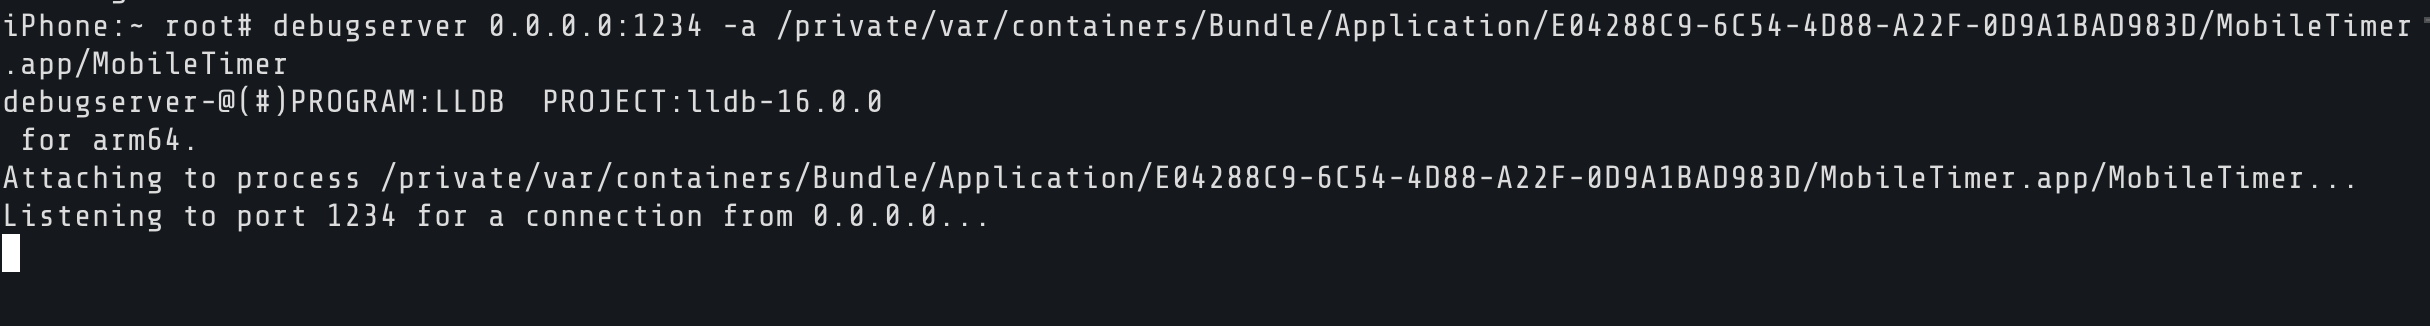
The Clock app on your device will freeze at this point. debugserver has grabbed it.
Now we can start lldb and connect:
If you were already in the shell having (lldb) prompt, type quit. Then run the command mentioned above. The -o flag executes the commands in the argument once loaded. This is equivalent of typing the command in the prompt of lldb.
Now, it should connect and hit the first breakpoint (where debugserver has already frozen the app):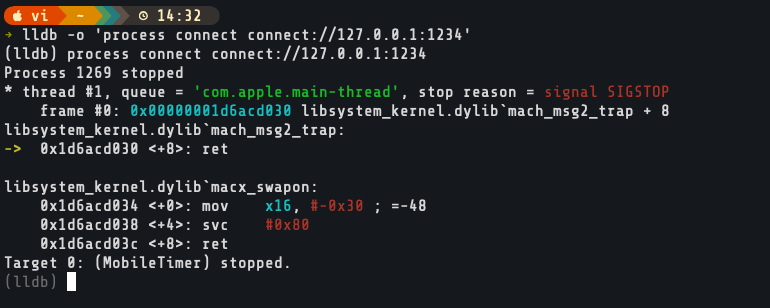
Waiting for an App to Launch
Sometimes you want to catch an app right from the start. Instead of attaching to a running process, you can tell debugserver to wait for it to launch:
The debugserver will sit and wait. It won't start its server until the process appears. Now open the Clock app on your device. debugserver grabs it as soon as it launches. Once that happens, connect LLDB the same way and you'll hit the first breakpoint as early as possible: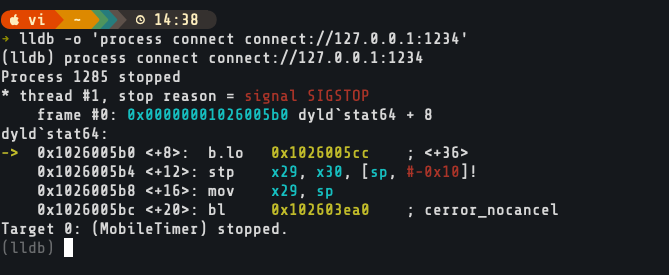
You're in control now. The Clock app is frozen mid-execution, waiting for you to tell it what to do.
Looking Around
Before we start exploring, let's get our bearings. If you ever forget a command, help lists everything and help breakpoint drills into specifics.
Check the process state with process status. It'll confirm the app is stopped and show you which thread you're on.
Every iOS app loads hundreds of frameworks at startup. image list shows all of them with their load addresses. To find just the Clock app's binary:
That gives you the base load address of the main executable. You'll need this when matching up addresses from your disassembler.
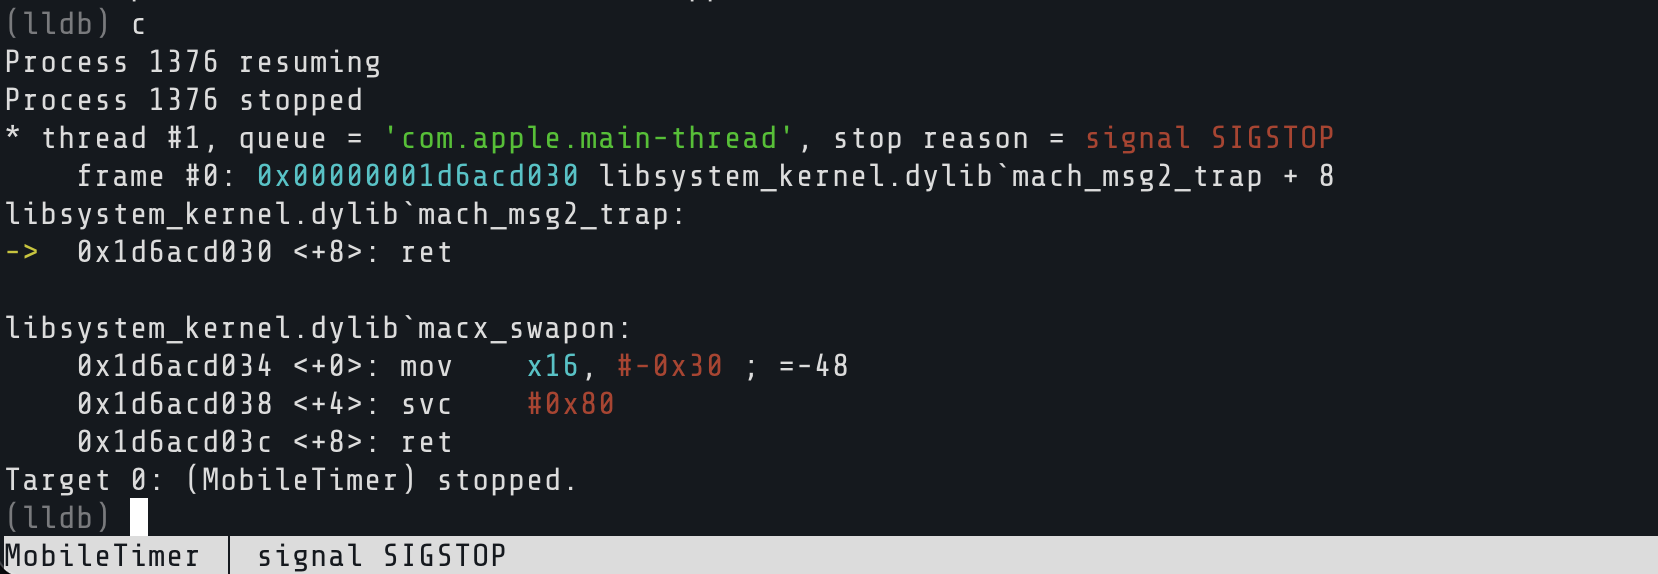
Letting It Run
The app is still frozen. Let it go:
Short for continue. If you're coming from GDB, you'll find this familiar. c, n, s, bt, x all work the same way. The Clock app comes back to life. UI works, timers tick, everything normal. But LLDB is still attached, watching.
Whenever you want to freeze it again, go to your LLDB terminal and hit Ctrl+C. That sends an interrupt and pauses execution wherever the app happens to be at that instant.
Play with this. Hit c to resume, tap around the Clock app, then Ctrl+C to freeze it. The app only runs when you let it.
Setting Traps: Breakpoints
Ctrl+C stops the app at random points. That's fine for poking around, but what if you want to stop at a specific moment? Like, exactly when a certain method gets called?
That's what breakpoints are for. You set a trap at a location in the code. When execution hits that spot, the app freezes and you get to inspect everything before deciding what happens next.
Breaking on a Method
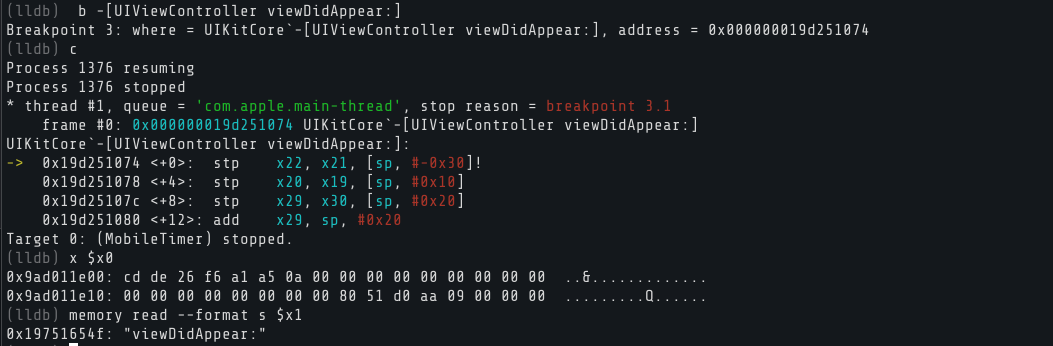
Every time a screen appears in iOS, viewDidAppear: gets called. Let's catch it:
LLDB confirms the breakpoint and tells you how many locations it resolved to.
Now resume:
Go to your phone and switch tabs. World Clock, Alarm, Stopwatch, Timer. The instant you switch, the app freezes. Your breakpoint fired. LLDB shows you which thread stopped, which function you're in, and the instruction it was about to execute.
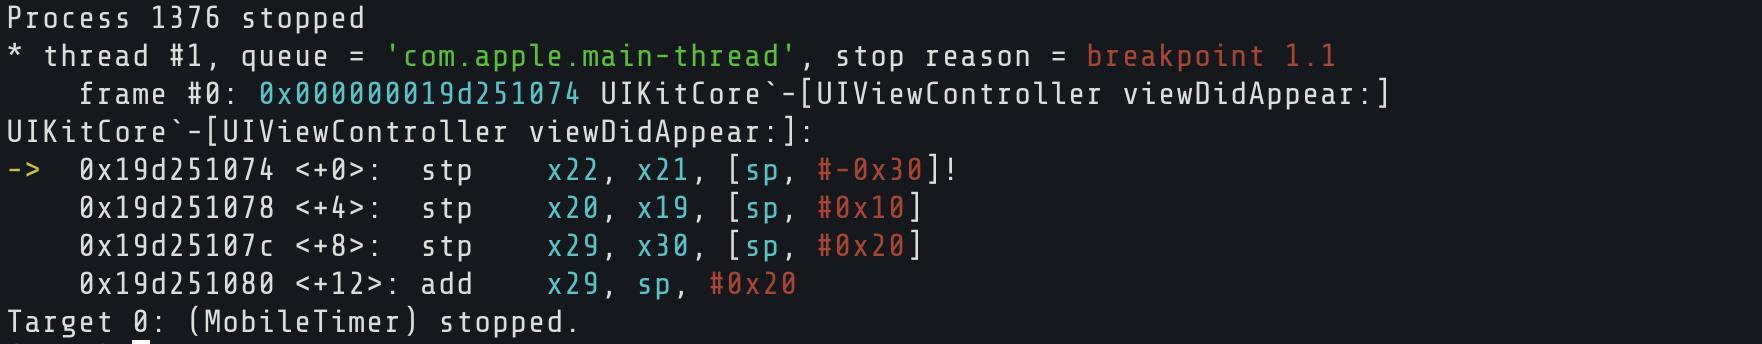
That's viewDidAppear: being called, live, on the actual device. Not theory. You just caught it in the act.
Breaking by Address
Sometimes you don't have a symbol name. Maybe you pulled an address out of Hopper or Ghidra from a stripped binary. LLDB doesn't care:
0x1a2b3c4d is not a real address. Addresses differ. Replace 0x1a2b3c4d with a real address and it'll stop right there.
Breaking by Selector
You can also blanket-break on every class that implements a particular selector:
Careful though, viewDidLoad exists in hundreds of classes. LLDB will set a breakpoint on all of them.
Here, I ended up setting 80 which is quite a large number for breakpoints:

Managing Breakpoints
You're going to accumulate breakpoints. Here's how to manage them.
List them:
Each one gets a number. If it resolves to multiple locations, you'll see sub-entries like 1.1, 1.2, 1.3, etc.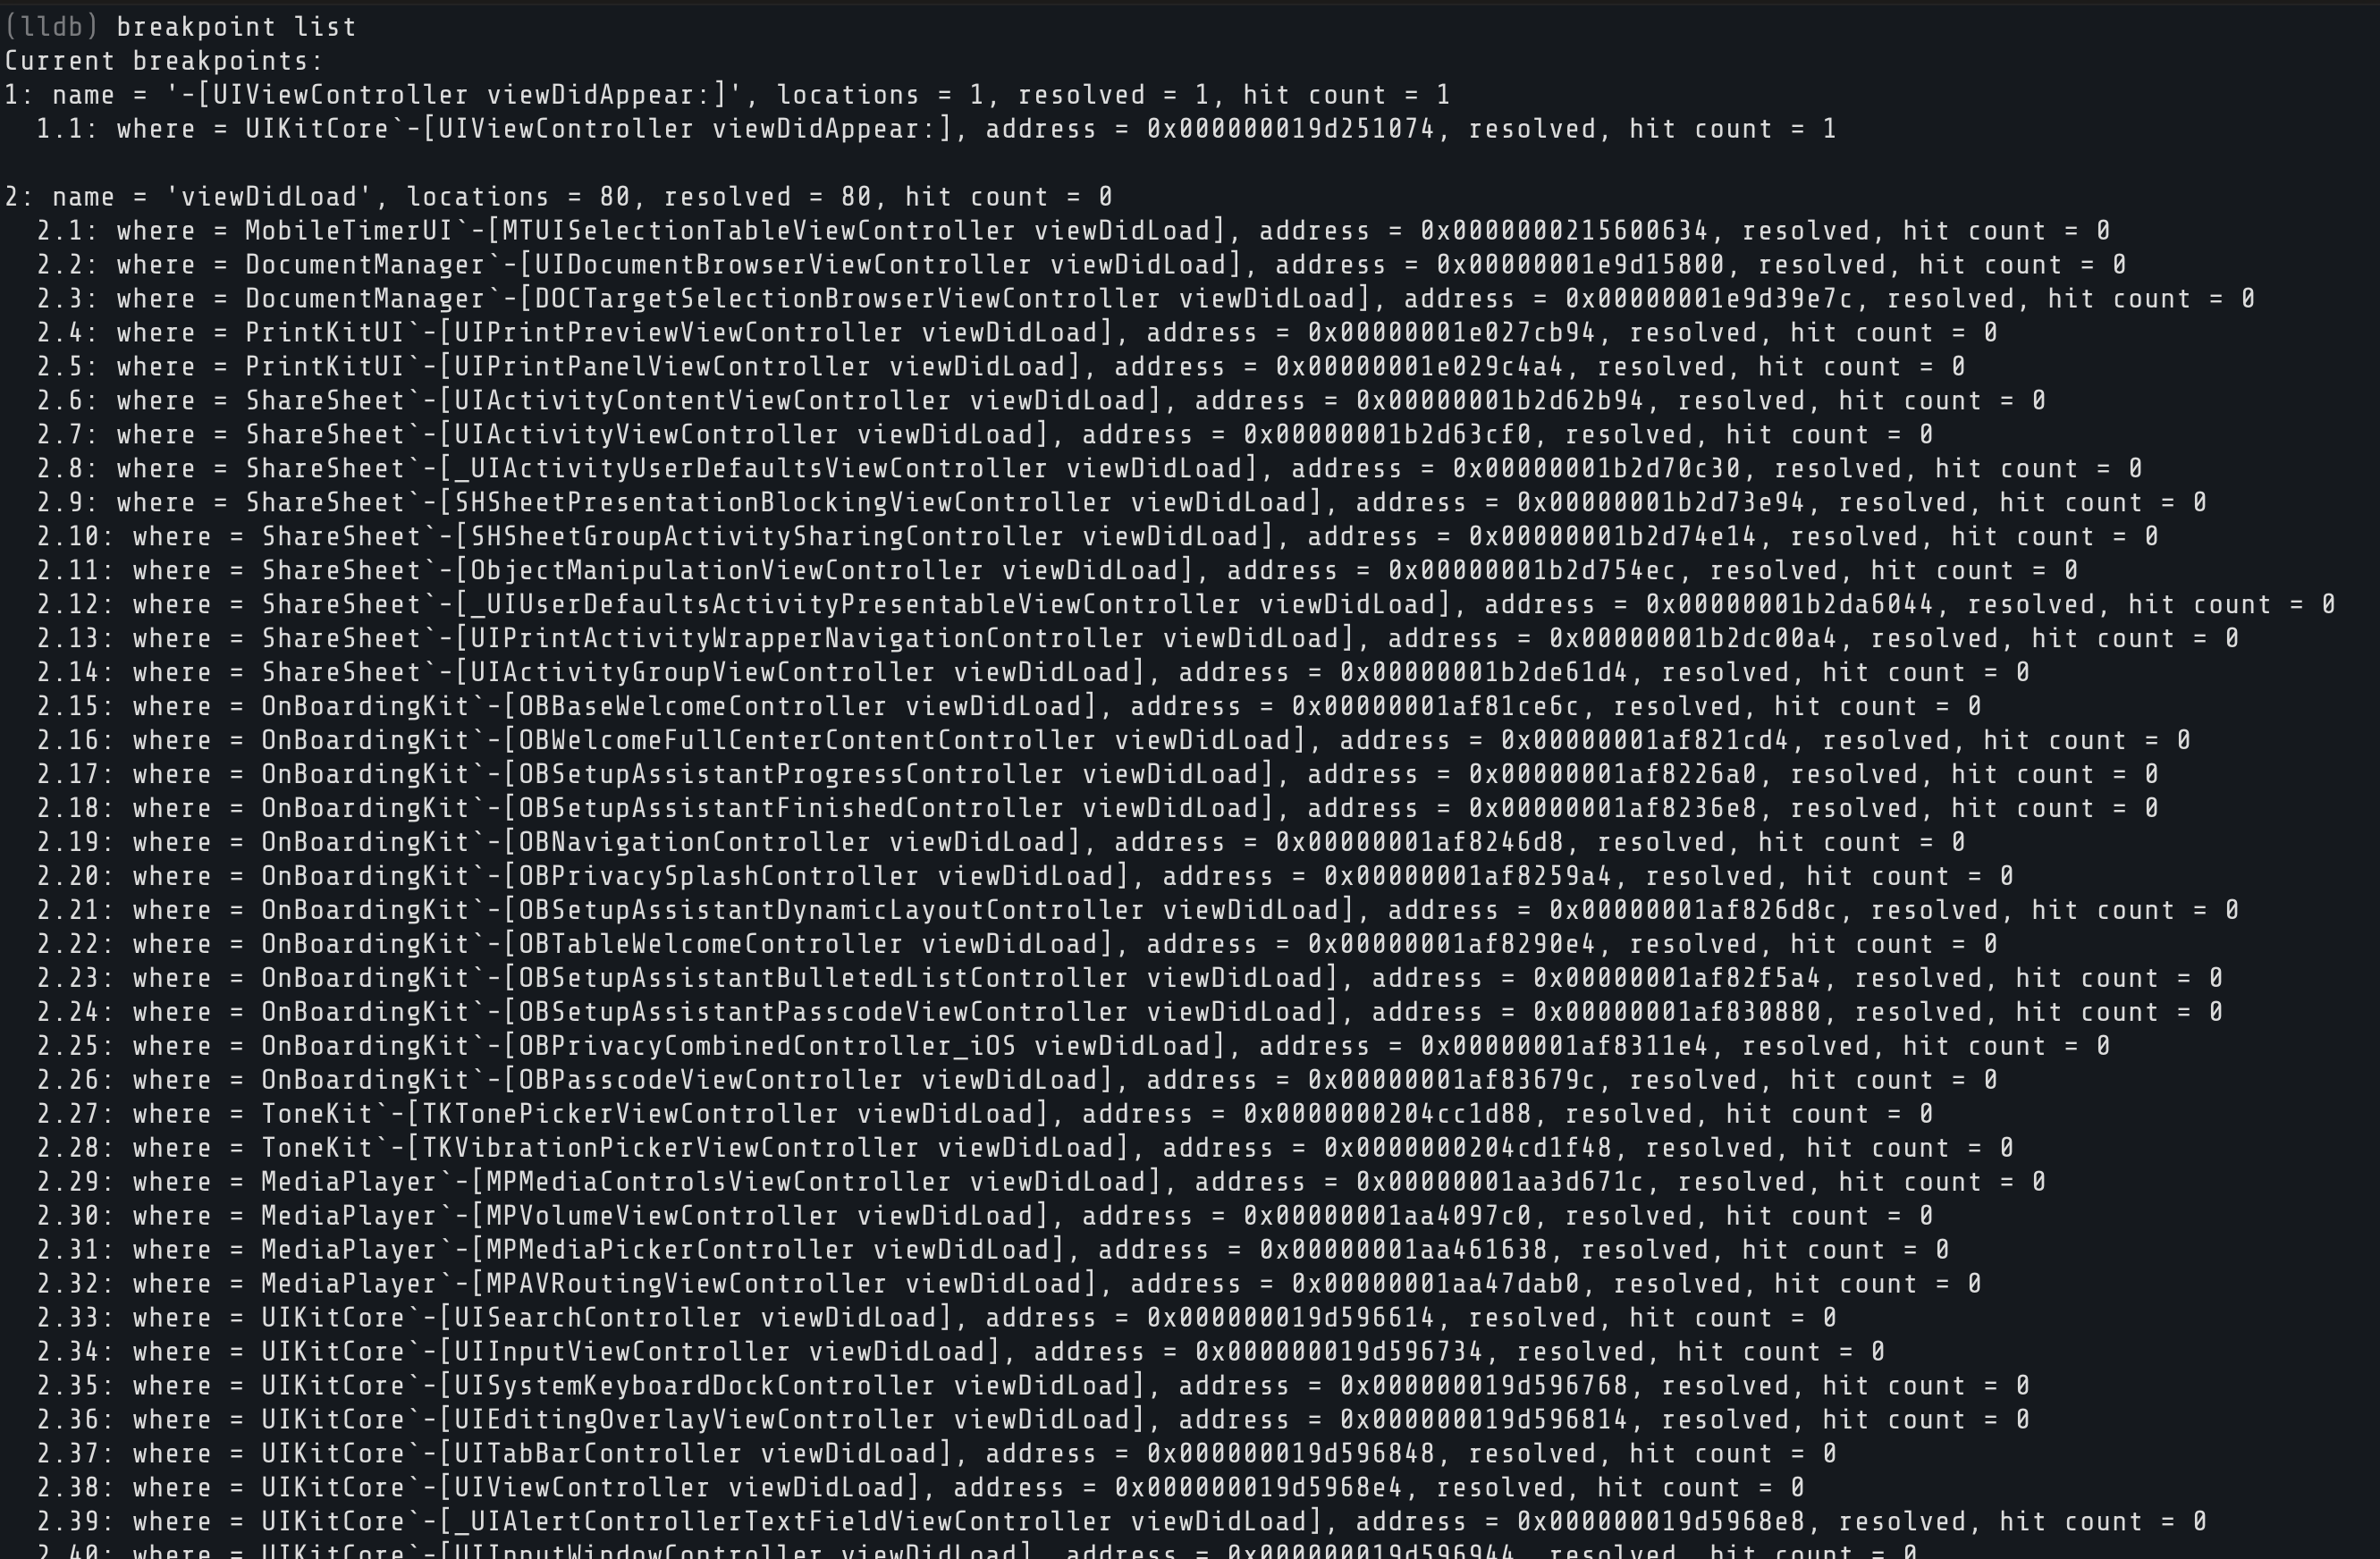
Disable (keep it, just stop it from firing):
Re-enable:
Delete one:
Delete all of them:
LLDB asks for confirmation before wiping everything.
Stepping Through Code
You hit a breakpoint. The app is paused. Now you can walk through execution one step at a time.
Step Over
Run the current line, move to the next. If it calls a function, the function runs to completion and you land after it:
Step In
Current line calls a function and you want to follow that call inside:
Step Out
You're inside a function and you've seen enough. Run the rest of it and pop back to the caller:
Instruction-Level Stepping
Those commands step by source lines. When you're reversing an app without source code, you need to step by individual assembly instructions:
Next instruction. Steps over one ARM64 instruction.
Step instruction. Steps into, following branches and calls.
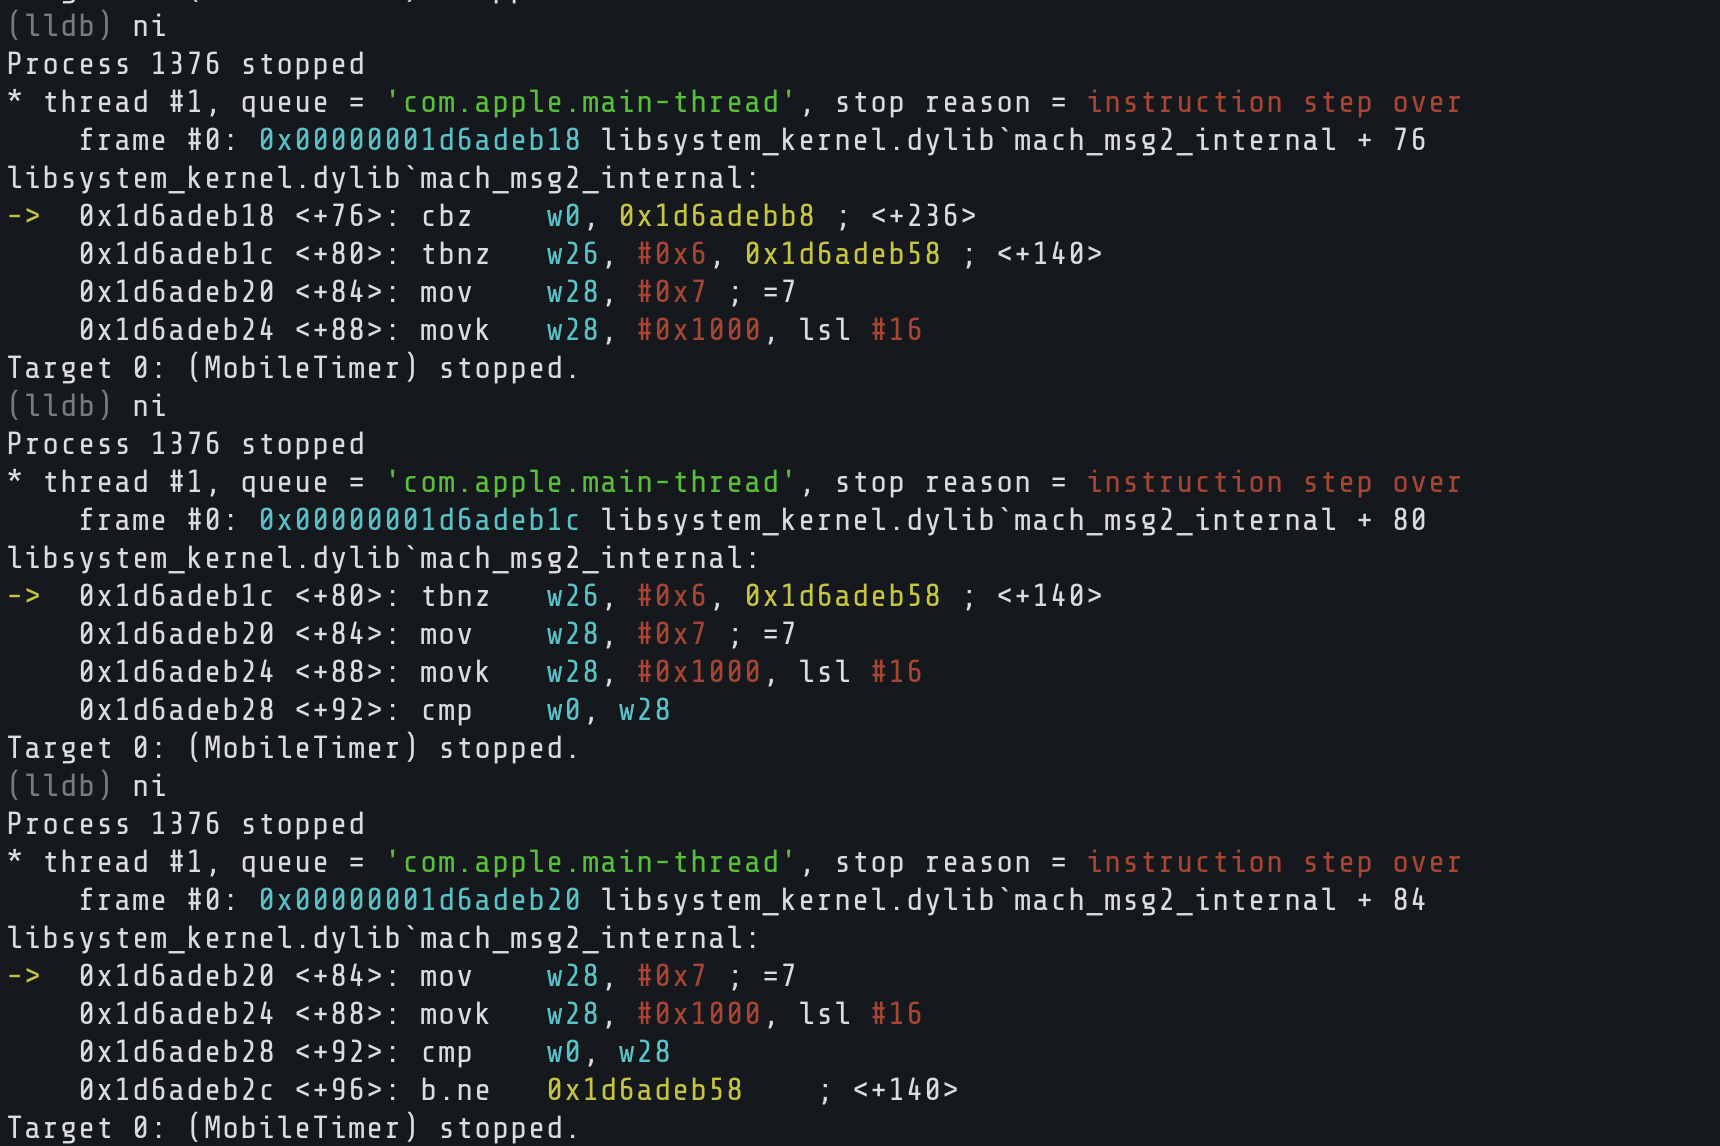
When you're doing RE work, ni and si are what you'll live in. One instruction at a time, watching registers and memory change with each step. GDB users will feel right at home here since ni, si, n, and s behave the same way.
The Call Stack
When the app pauses, you're somewhere in the middle of a chain of function calls. bt (backtrace) shows you the full chain:
Frame 0 is where you are. Frame 1 is who called you. And so on. You can jump to a different frame with f 3 to inspect its state, or use bt all to see every thread's backtrace at once.
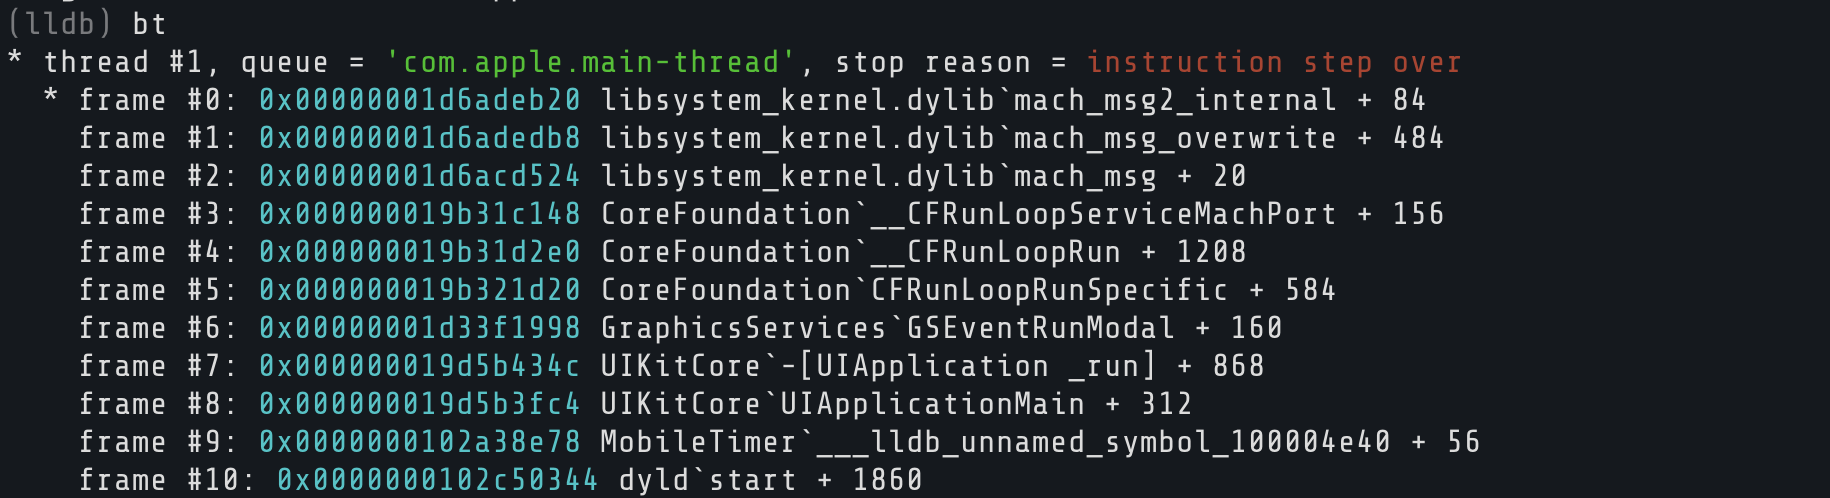
The Clock app runs on many threads. thread list shows all of them. Thread 1 is usually the main thread handling UI.
Registers
Registers are tiny storage slots inside the CPU. As we covered in the Objective-C primer, on ARM64 x0 holds the object, x1 holds the selector, and x2 onwards hold method arguments. pc is the program counter (next instruction), lr is the return address, and sp is the stack pointer.
To dump all registers:
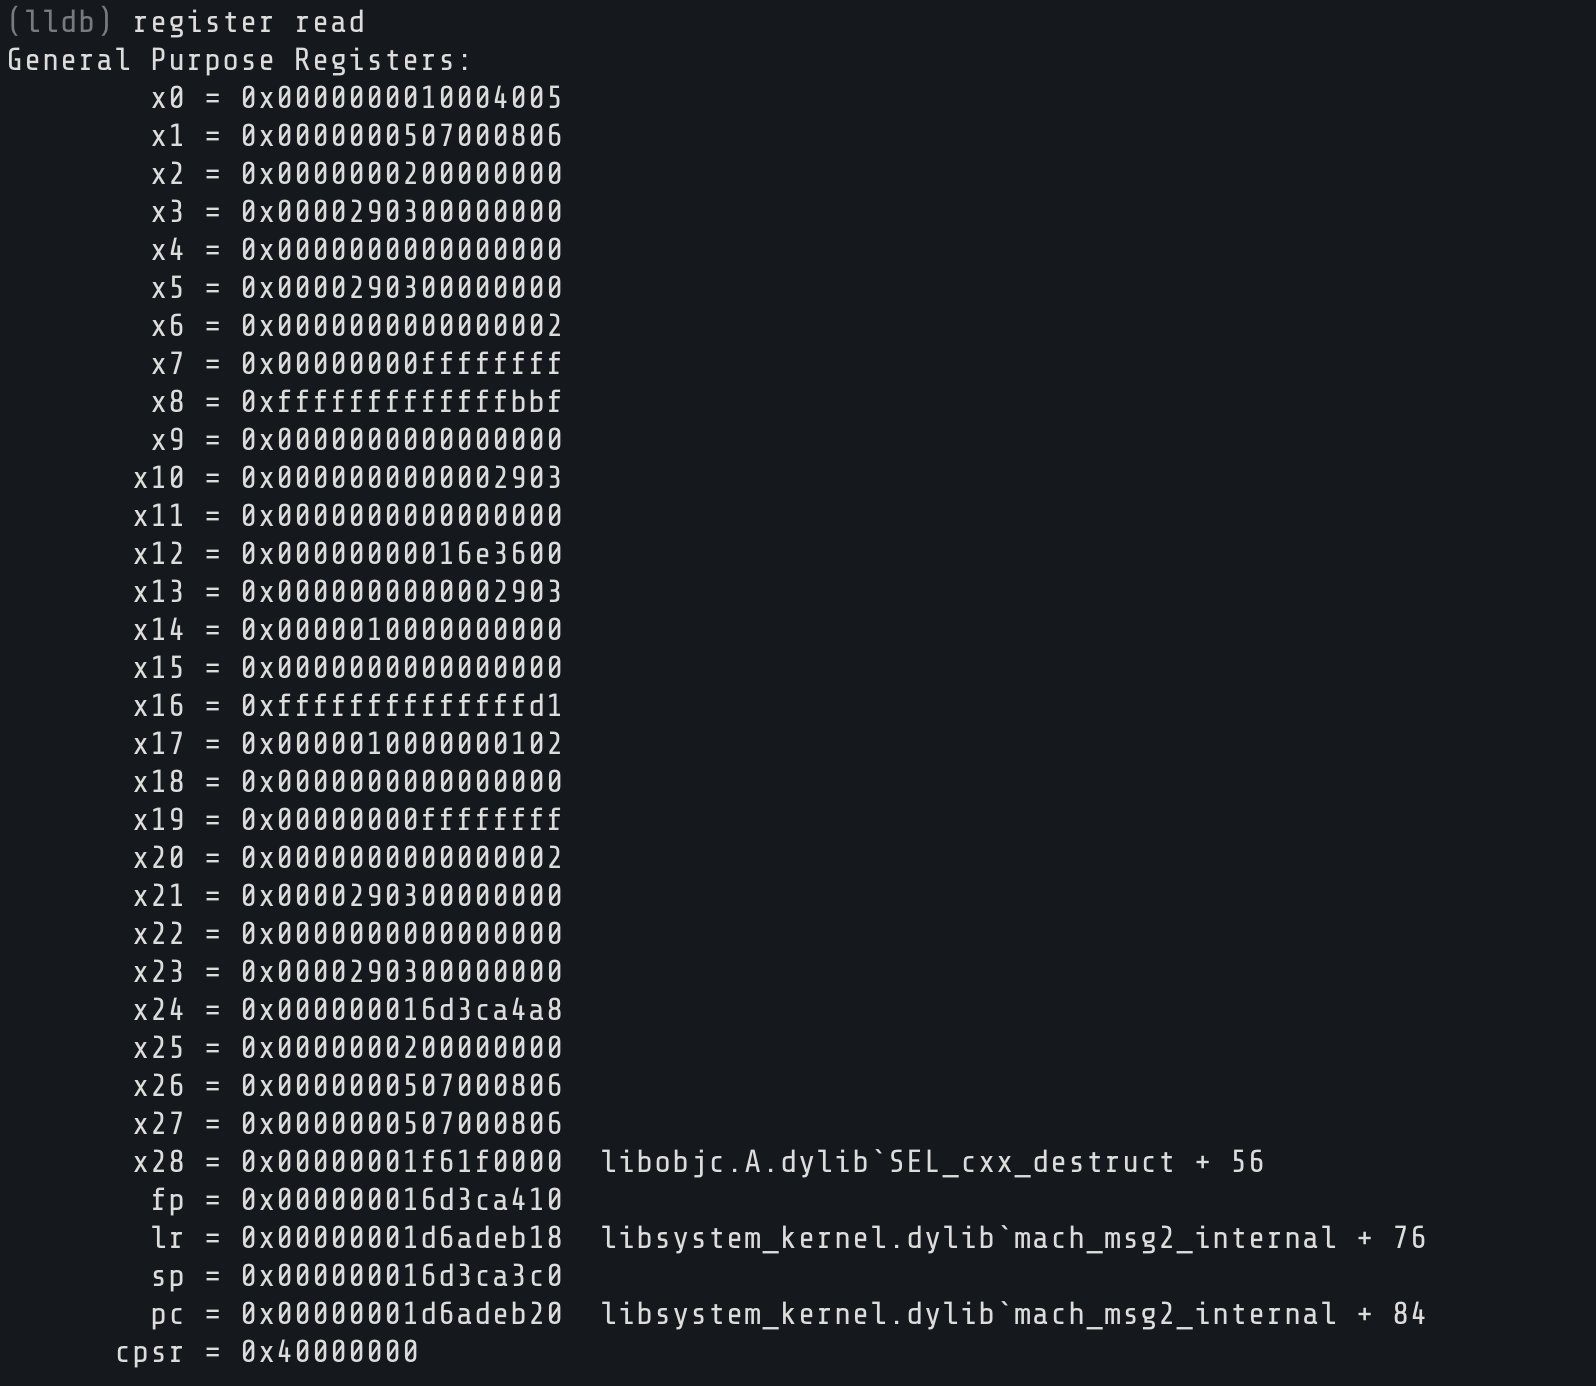
Usually you only need a few: register read x0 x1 x2. And register read pc tells you exactly where execution is right now.
Memory
Registers point into the app's memory space. x (shorthand for memory read) lets you peek at it:
Shows 32 bytes at the address in x0 as a hex dump. You can also read memory as a string, which is handy for reading selectors:
For more control over format: x/16xb $x0 reads 16 bytes in hex, and memory read --size 1 --format x --count 64 $x0 reads 64 bytes.
Expressions
LLDB can evaluate expressions inside the live process. This includes calling Objective-C methods.
podescription on an ObjC object:
When stopped in an ObjC method, x0 is self, so this tells you what object you're dealing with.

You can also cast register values: expression (char *)$x1 reads the selector as a string. And you can call functions directly inside the app:
That actually runs NSLog in the Clock app's process space. Use p instead of po when you want raw values: p (int)$x2 for integers, booleans, etc.
Changing Things at Runtime
LLDB lets you reach in and change things too. Picture a function that returns a boolean, 0 for no, 1 for yes. Maybe it's a license check. If you catch it right as it returns, you can flip x0:
The app behaves as if the check passed. You didn't patch a single byte on disk.
You can also write directly to memory with memory write 0x1a2b3c4d 0x42. Write to the wrong address and the app will crash, so know what you're targeting.
Exploring the Objective-C Runtime
The ObjC runtime is packed with metadata we can query. The trick is knowing what to look for. Apple's internal class names rarely match what you see on screen, so you need to discover them.
Use image lookup to search for symbols inside the binary:
This regex-searches all symbols in MobileTimer that contain "Alarm". You'll see a flood of results. Methods, selectors, stubs. Scroll through and you'll start to notice class names repeating. That's your map of how the app is organized.
You can also search for view controllers specifically:
Once you spot an interesting class, dump all its methods:
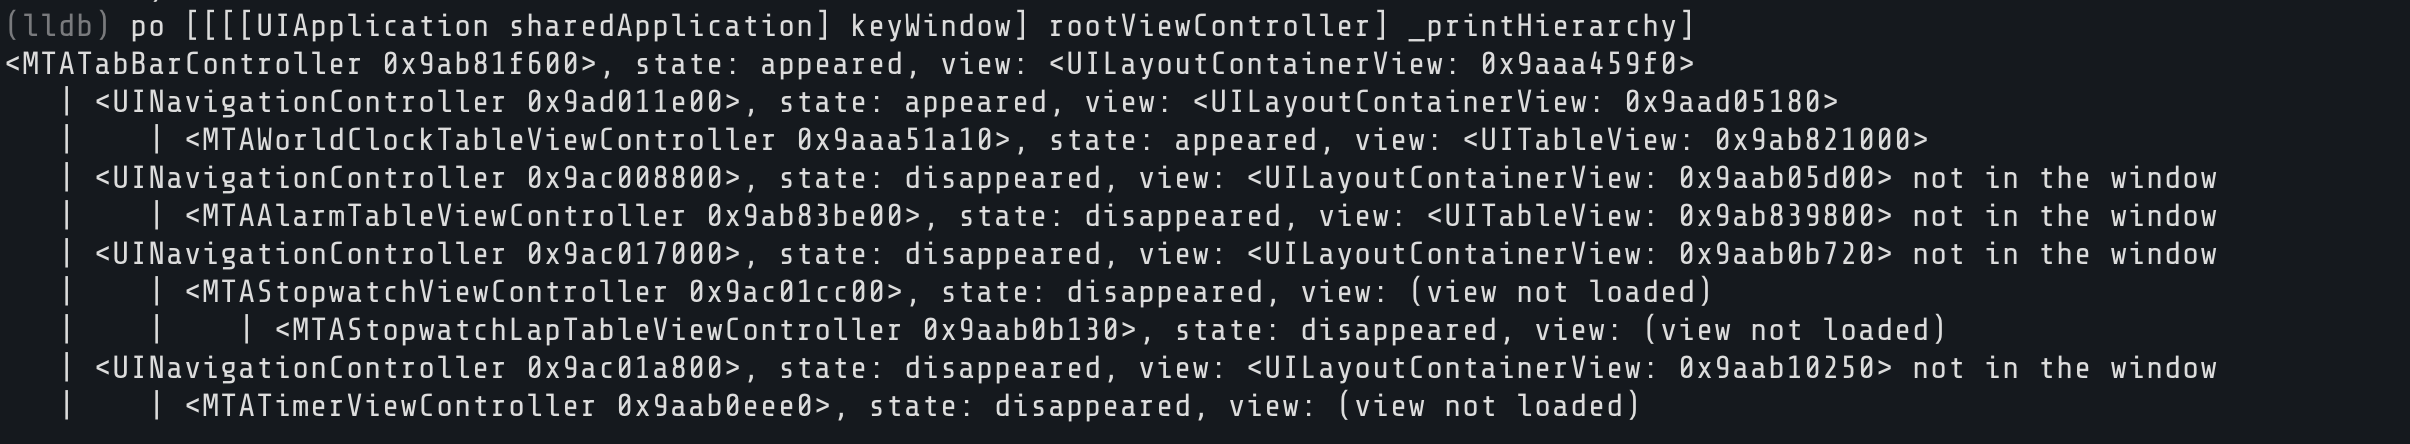
Replace ClassName with whatever you found. This dumps every method on that class with argument types and return types. It's like pulling a blueprint out of a compiled binary. If it returns nil, the class doesn't exist on your iOS version. Try another one. You can find active classes by looking into keyWindow:
That tells you exactly which classes are active right now.
And then you can simply dump all its methods: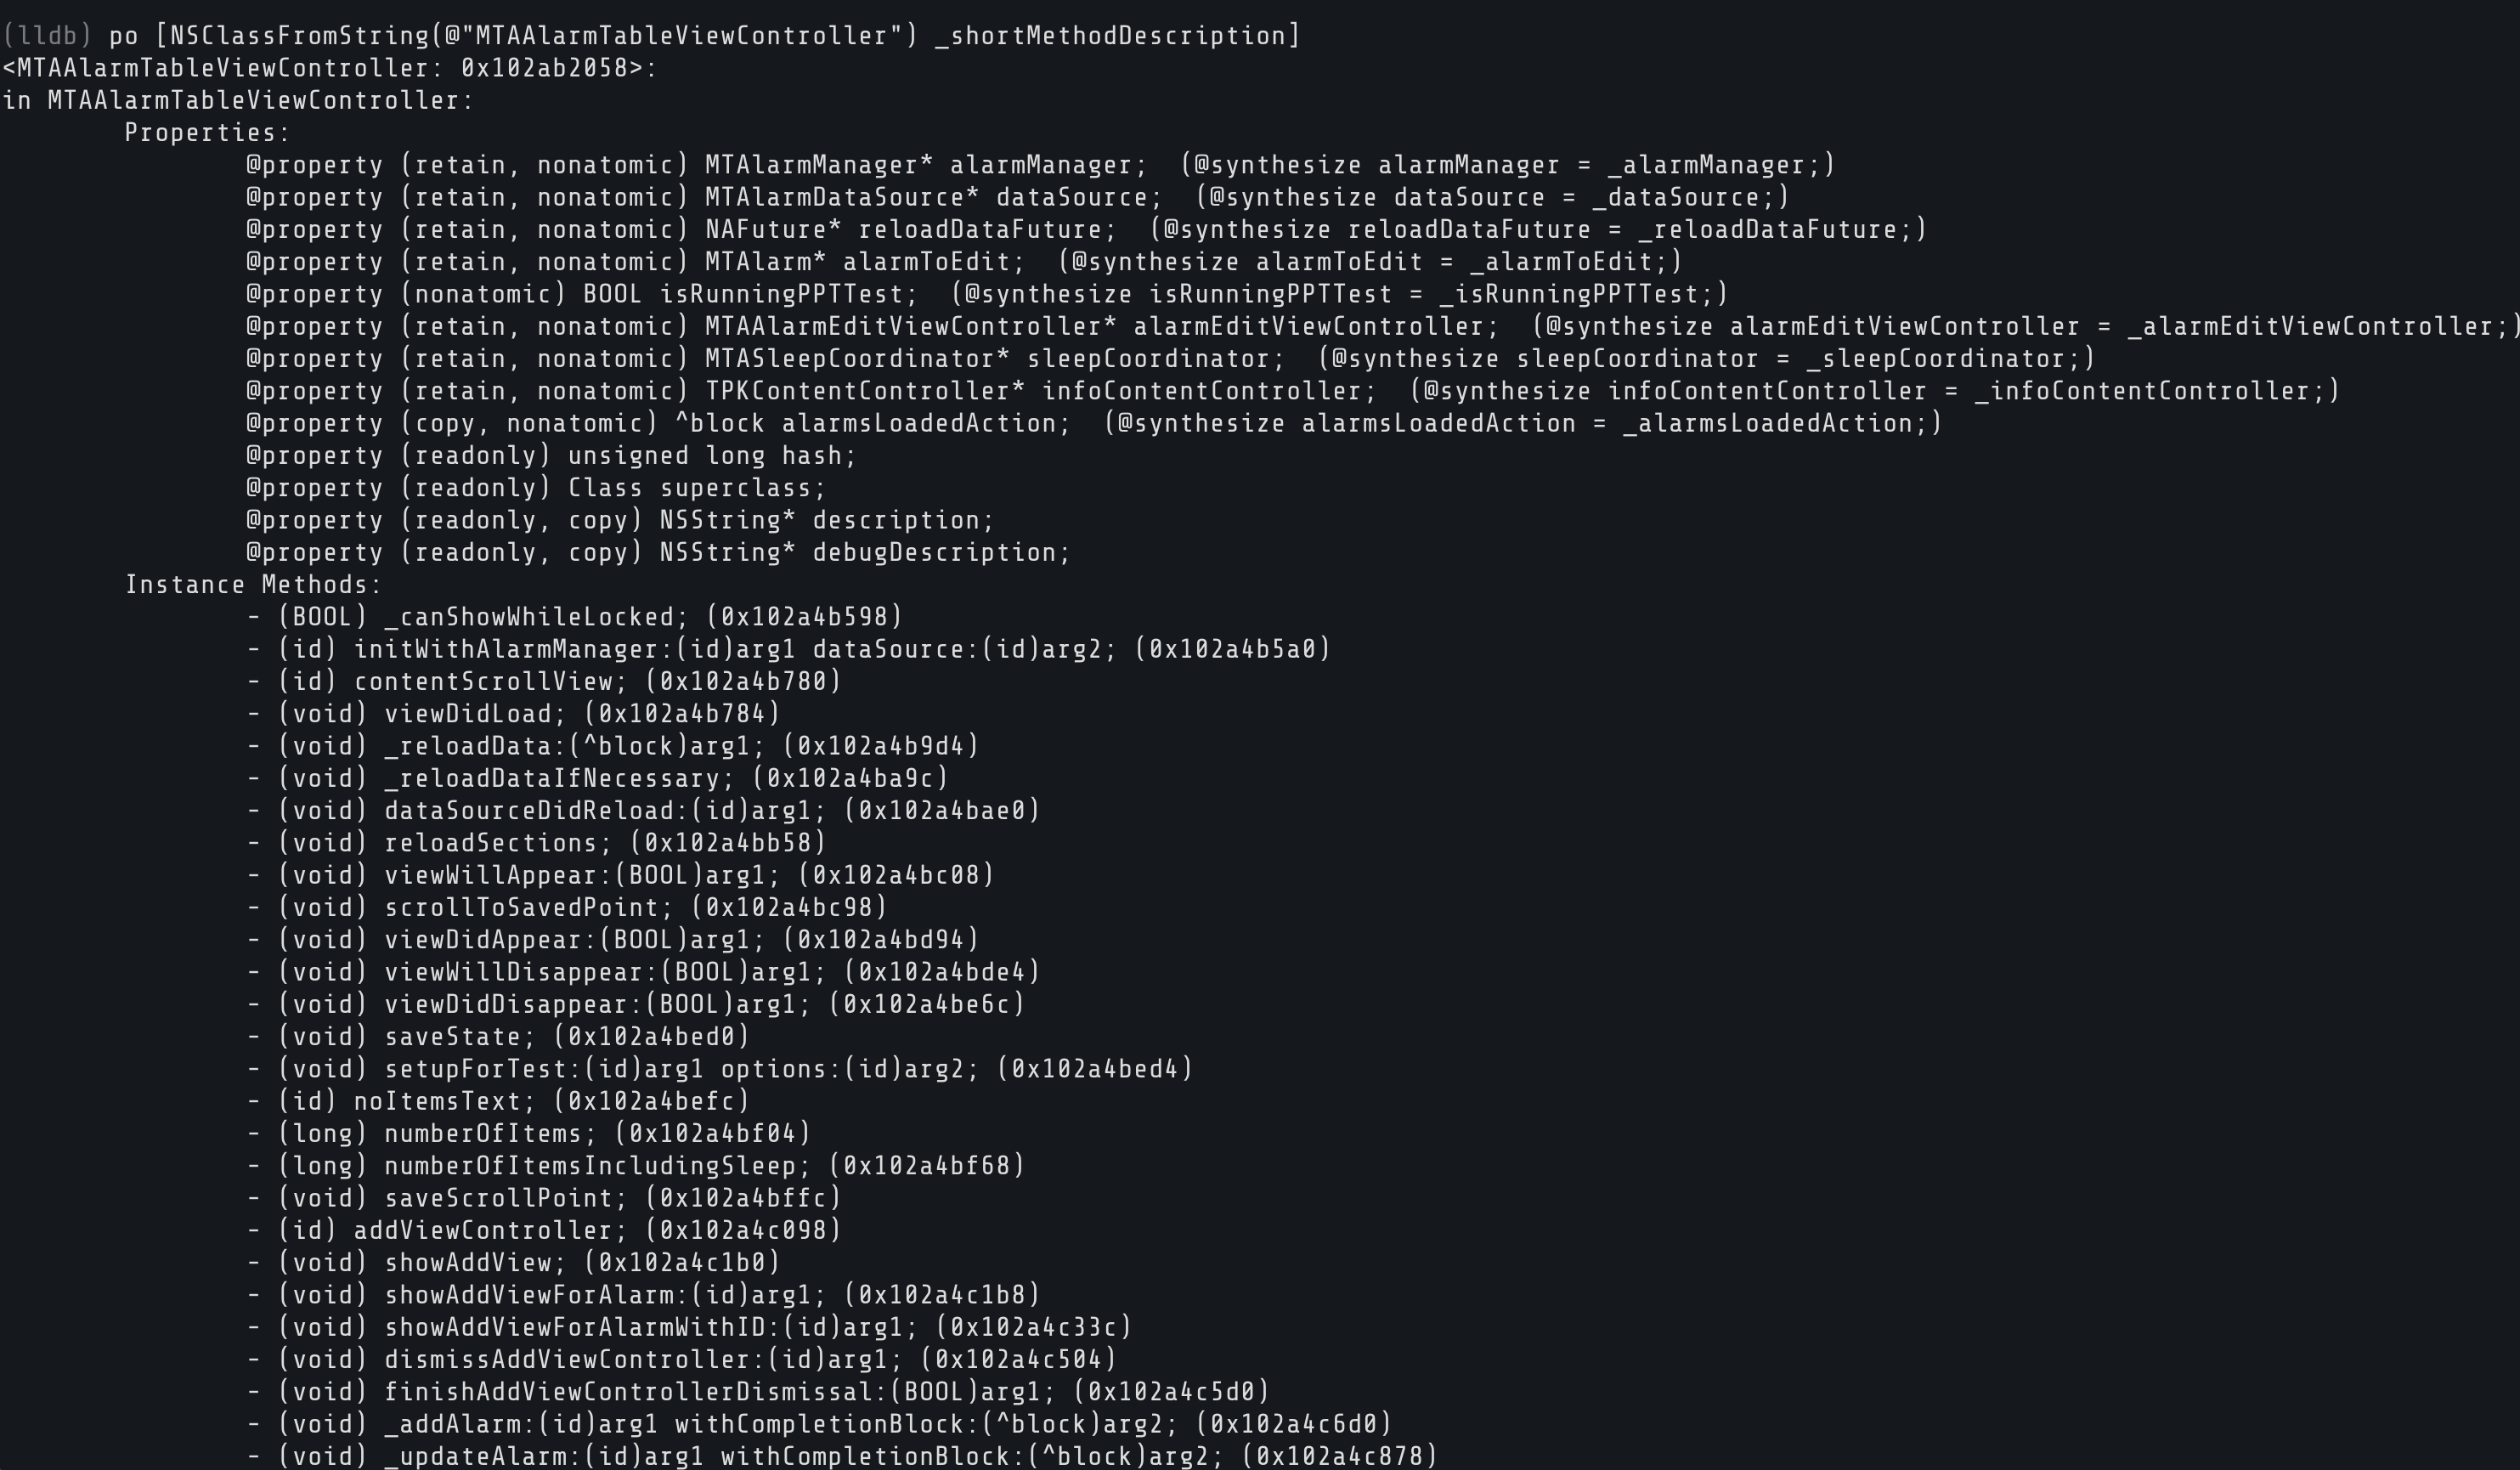
Disassembly
Usually you do not have source code when you are reverse engineering the application. di -f shows the assembly of the current function, with an arrow (->) marking the next instruction:
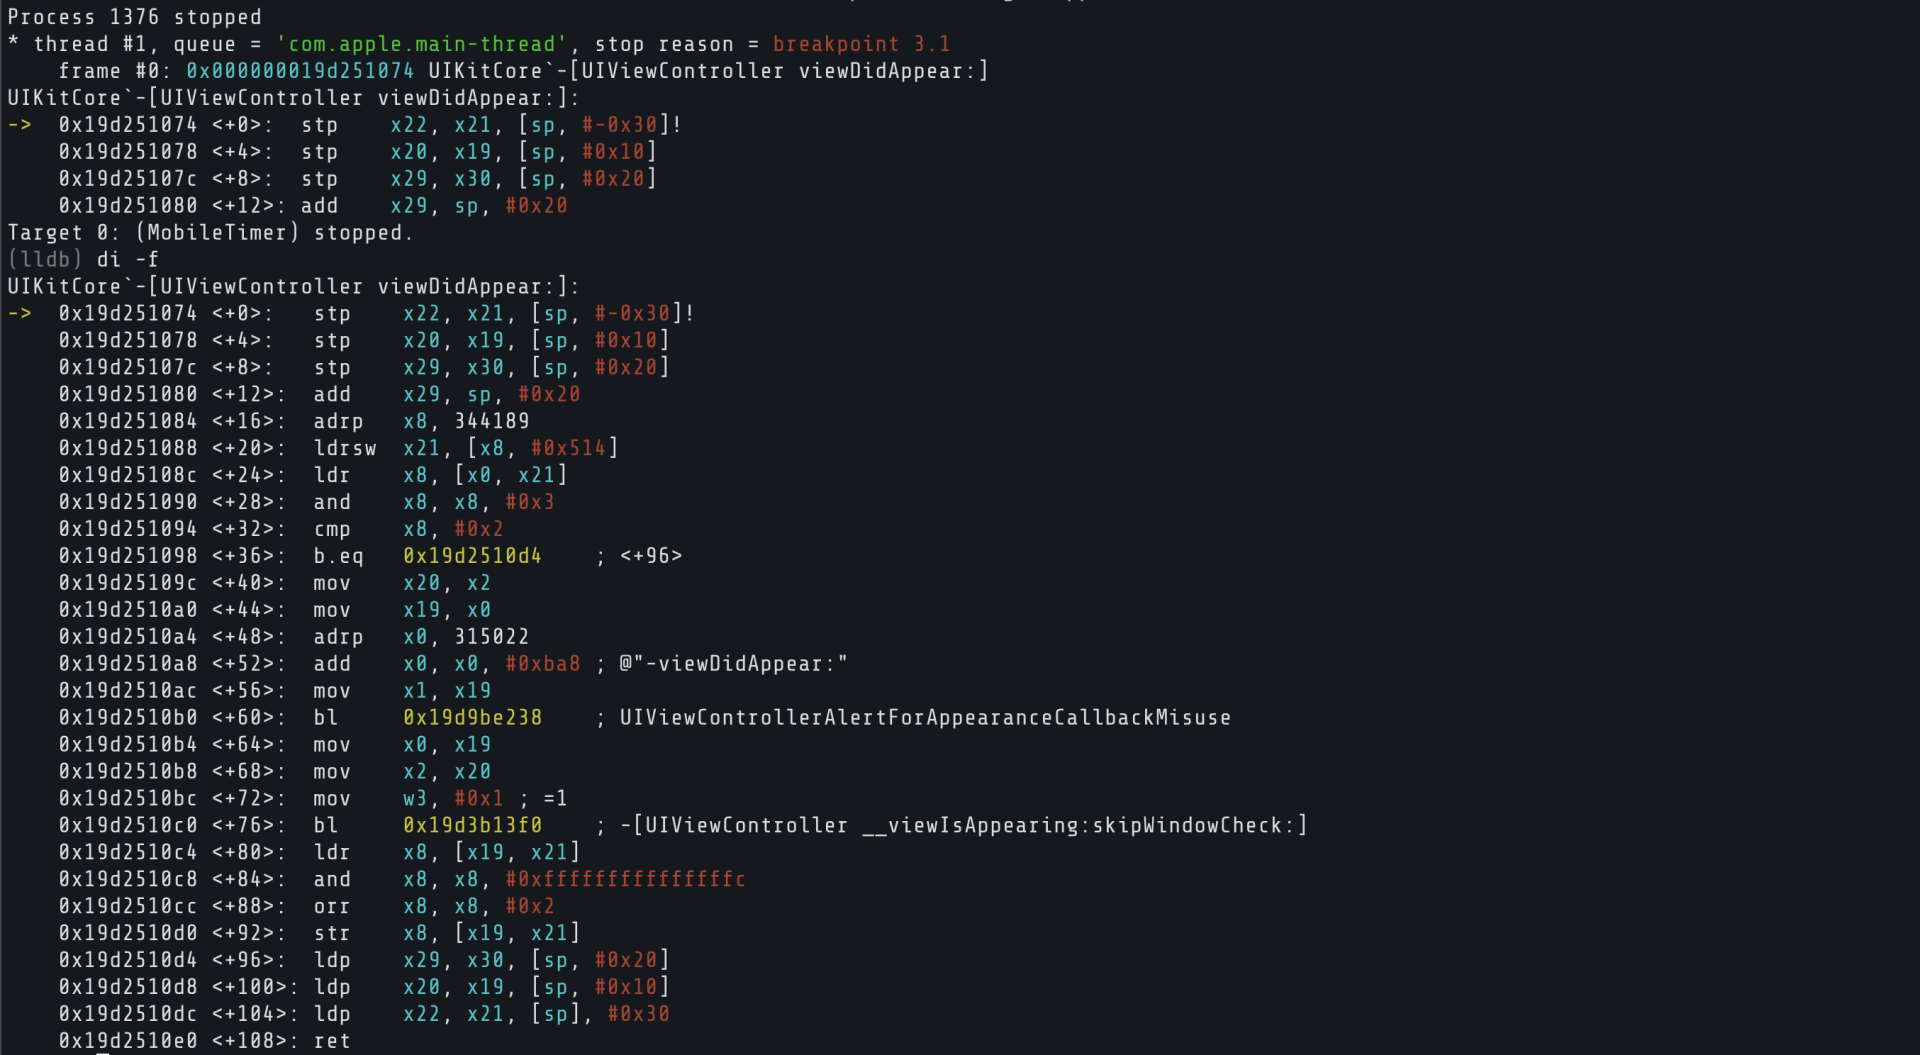
You can also disassemble a specific method by name. If you found a class through image lookup, use it here:
Or from a raw address: disassemble --start-address 0x1a2b3c4d --count 20.
Since we're debugging without source code, we can tell LLDB to always show assembly when the process stops:
LLDB also has a built-in Python interpreter for automating analysis, but that's a topic for another article.
Watchpoints
Breakpoints trigger on code. Watchpoints trigger on data. Want to know the exact moment something writes to a memory address?
You can also watch for reads (-w read) or both (-w read_write). When one fires, LLDB shows you the old and new values. Manage them with watchpoint list and watchpoint delete.
Wrapping Up
When you're done:
Detach to let the app keep running without LLDB:
Quit to exit LLDB entirely:
If you're still attached, it'll ask whether to detach or kill the process.

What's Next
This article was just a basic introduction on how to move around LLDB and debug an application. Everything we learned today works on any iOS app. Try attaching to a process, set breakpoints, read registers and memory, evaluate expressions, modify values at runtime, and disassemble functions.
LLDB isn't limited to iOS either. It works on Android as well, since Android NDK ships with lldb-server and Android Studio uses LLDB as its default debugger. If you're more familiar with GDB, you've probably noticed that many commands (c, n, s, bt, x, ni, si) are the same or very similar. We teach GDB in depth in our Android Userland Fuzzing and Exploitation course, covering everything from userland debugging to exploitation.
Practice on Real Bugs
If you want to put these skills to work, we have free labs with real memory corruption bugs you can poke around with using a debugger. Especially, Pictator and Broke Lesnor are worth looking into with lldb as they contain memory bugs.
Community Writeups
Our community has published some great writeups that show these techniques in action:
- Captain Nohook Lab Writeup by nullbyte.club
- No Escape Lab Writeup by n0psn0ps